Discover graduate outcomes

An interactive dashboard suite co-designed with graduate career professionals from the higher education sector to help universities analyse the outcomes of their graduates.
About discover graduate outcomes
Insights from these dashboards will help support strategic planning and reporting for careers advisors, planners and senior management within higher education institutions.
You will be able to benchmark your performance with sector peers regionally, nationally and by provider groups.
Insights focus on graduate outcomes and student characteristics enabling year-on-year comparison between four years (2017/18, 2018/19, 2019/20 and 2020/21). This relates to:
- Percentage of graduates obtaining ‘positive outcomes’ by securing a highly skilled professional role or continuation of study
- Employment and unemployment data (including self-employment and running a business) by median salary, occupation, industry sector, location of work and highly-skilled roles
- Further or interim study including level of study (doctorate, first degree, post-graduate, other higher degree) and principal subject
- Graduates' own reflections on their current workplace experiences and the relevance of their studies
- Student characteristics by ethnicity, disability, sex, age, degree class, Participation of Local Areas (POLAR4), English Indices of Multiple Deprivation (IMD), Scottish Index of Multiple Deprivation (SIMD) and Welsh Index of Multiple Deprivation (WIMD)
List of dashboards
The navigation portal and 16 dashboards includes:
Discover graduate outcomes
- Graduate outcomes overview
Outcomes and reflections
- Outcomes and student characteristics
- Reflections and student characteristics
- Employment and student characteristics
- Positive outcomes
Employment
- Employment overview
- High-skilled employment
- Employment destination
- Occupation and industries
- Providers, domiciles and employment
Self-employment
- Self-employment overview
- Self-employment and student characteristics
- Freelancing and self-employment
- Running a business
Further study
- Further study overview
- Further study and interim study
Example of graduate outcomes overview dashboard
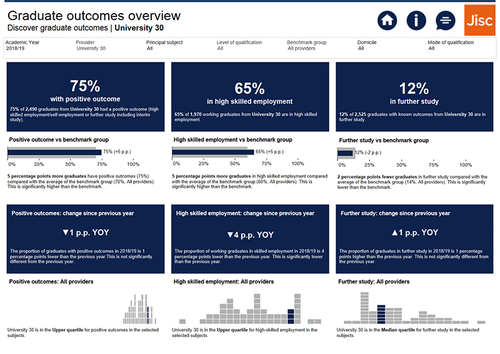
The below dashboard shows summary graduate benchmarking metrics from the product for an example university. This includes the percentage of graduates with a positive outcome, the proportion in highly skilled employment and the percentage in further study. Each metric is contextualised against other providers.

Please note: this example uses synthetic and anonymised data.
The below dashboard shows summary graduate benchmarking metrics from the product for an example university. This includes the percentage of graduates with a positive outcome, the proportion in highly skilled employment and the percentage in further study. Each metric is contextualised against other providers.

Please note: this example uses synthetic and anonymised data.
Example of providers, domiciles and employment dashboard
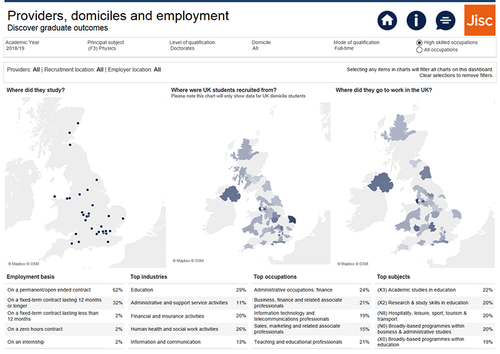
The dashboard below shows graduate location information from the product in the form of maps. This includes where in the UK they came from to study, where they studied and where they went to work after graduation. There is also information on the basis of employment as well as top industries, occupations and subjects.

Please note: this example uses synthetic and anonymised data.
The dashboard below shows graduate location information from the product in the form of maps. This includes where in the UK they came from to study, where they studied and where they went to work after graduation. There is also information on the basis of employment as well as top industries, occupations and subjects.

Please note: this example uses synthetic and anonymised data.
Example of self-employment overview dashboard
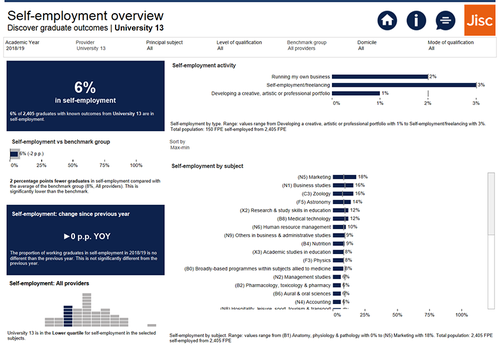
This dashboard shows an overview of graduate self-employment from the product for an example university. This includes metrics on the proportion of graduates in self-employment, the type of self-employment being undertaken and self-employment by subject. Benchmarking information against other providers is also included for strategic analysis.

Please note: this example uses synthetic and anonymised data.
This dashboard shows an overview of graduate self-employment from the product for an example university. This includes metrics on the proportion of graduates in self-employment, the type of self-employment being undertaken and self-employment by subject. Benchmarking information against other providers is also included for strategic analysis.

Please note: this example uses synthetic and anonymised data.
Benefits
The interactive dashboard suite draws data from HESA data's graduate outcomes survey, conducted 15 months after graduation. This provides more meaningful data than a graduate destination survey conducted closer to the point of graduation, allowing graduates more time to establish their post-graduation activity.
Other benefits:
- Year-on-year comparison between the four years of survey data (2017/18 - 2020/21), with percentage point change indicators
- Access standardised metrics for key areas such as positive outcomes, highly skilled employment, further study, graduate perspectives and self-employment
- Switch between overview and detail-level analysis easily
- Sector-benchmarking functionality - regionally, nationally and by provider group with visual charts for easy comparison
- Z-testing narrative - to better understand 'significant' vs 'non-significant' changes and quartile comparisons
- Visual geographical mapping - to easily analyse student and graduate flow
- Save time and money - an easy-to-use, out-of-the-box data visualisation and analytics dashboard suite
- Accessible analytics for multi-departmental use - including careers, planning and management
- Ability to produce in-depth analytical reports to feed your institutional key performance indicators, without the need of data specialists
“Jisc’s new graduate dashboards deliver the best insight we’ve ever seen on self-employment.”
Gareth Trainer, director, Enterprise Educators UK (EEUK)
Who is it for?
The discover graduate outcomes interactive dashboard suite is for higher education professionals and sector bodies responsible for:
- Careers advice
- Strategic planning
- Student recruitment
- Business intelligence
- Departmental management
Accessing the dashboard
Once subscribed, the dashboard suite will be delivered via your Heidi Plus account.
To access Heidi Plus, please contact your organisation’s Heidi Plus lead contact or email customer.success@jisc.ac.uk.
Pricing
Discover graduate outcomes is available with an annual subscription fee between £541 - £2,433 + VAT (dependent on the number of students at your provider).
Get started
Register your interest to arrange your initial consultation.
Data sources
The data within the discover graduate outcomes dashboard is quality assured and goes through strict validation processes.
- Graduate outcomes (focusing on the mandatory responses within the survey)
- HESA data student
- English Indices of Multiple Deprivation (IMD)
- Welsh Index of Multiple Deprivation (WIMD)
- Scottish Index of Multiple Deprivation (SIMD)
- Participation of Local Areas (POLAR 4)
- Government office region of student domicile 4-way split
- Government office region of location of institution
- Country of institution with Open University split by national centres
- Standard Industrial Classification (SIC2007)
- Standard Occupational Classification (SOC2020)
ISO certification
This service is included within the scope of our ISO9001 certificate.
