Discover progression - undergraduate to postgraduate

An interactive dashboard suite co-designed with strategic planning professionals to help universities track progression of undergraduate qualifiers into postgraduate education.
About discover progression
This interactive dashboard suite has been developed by Jisc and co-designed with strategic planning professionals from the higher education sector.
It uses multiple years of linked HESA data to help you determine:
- How many of your undergraduate qualifiers move into postgraduate study
- Where they progress to
- Postgraduate entrant gain/loss benchmarked against the HE sector and specific comparators
- Key characteristics of those who progress
If you work in postgraduate recruitment, postgraduate portfolio design or strategic planning, you will find this dashboard suite particularly valuable.
The dashboards will allow you to:
- Understand where your undergraduate qualifiers progress to for postgraduate study
- Track the gain/loss of postgraduate entrants across the sector
- Determine the best complementary subjects of those who progress to postgraduate study
- Understand the characteristics of those who do / do not progress, to develop support for postgraduate progression
- Benchmark your progression indicators against the HE sector
- Gain value from linked data spanning multiple years
This service falls outside the standard Heidi Plus subscription.
Key benefits
- Includes dashboards that have been fully co-designed with strategic planning professionals to help you understand why undergraduates do, or do not, progress to postgraduate study, where you lose out to competitors and what the trends have been over multiple years
- Provides easy to understand visual charts to allow for effort-free comparisons and year-on-year analysis over five years of qualifier data
- Benchmark your organisation’s performance sector wide
- Save time and money - an easy-to-use, out-of-the-box data visualisation and analytics dashboard suite
- Accessible analytics for multi-departmental use - including postgraduate portfolio planners, student recruiters and management
- Ability to produce in-depth analytical reports to feed your institutional key performance indicators, without the need of data specialists
- You are fully supported by the customer success team from day one
List of dashboards
- Progression overview
- Gain and loss
- Contextual questions
- Distance between undergraduate and postgraduate
- Postgraduate characteristics (1)
- Postgraduate characteristics (2)
- Complementary subjects
- Non-progression (1)
- Non-progression (2)
- Progression overview
- Gain and loss
- Contextual questions
- Distance between undergraduate and postgraduate
- Postgraduate characteristics (1)
- Postgraduate characteristics (2)
- Complementary subjects
- Non-progression (1)
- Non-progression (2)
Example dashboard: Progression overview
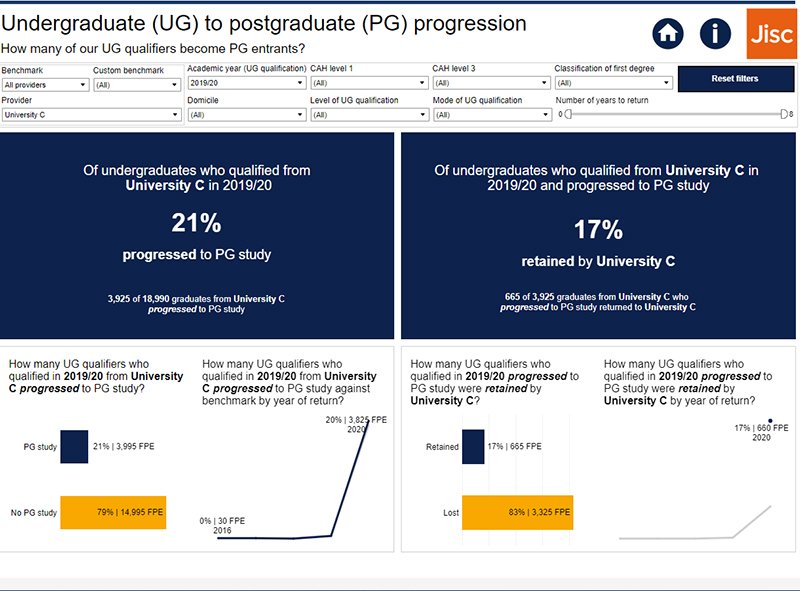
This example shows synthetic data for “University C”. The overview displays clearly the percentage of undergraduates progressing to postgraduate study during the time elapsed since graduation as well as the percentage of these students who were retained by University C.
The data can be easily filtered to allow the dashboard to display relevant information to the user.
Please note: this example uses synthetic and anonymised data.

Example dashboard: Gain and loss
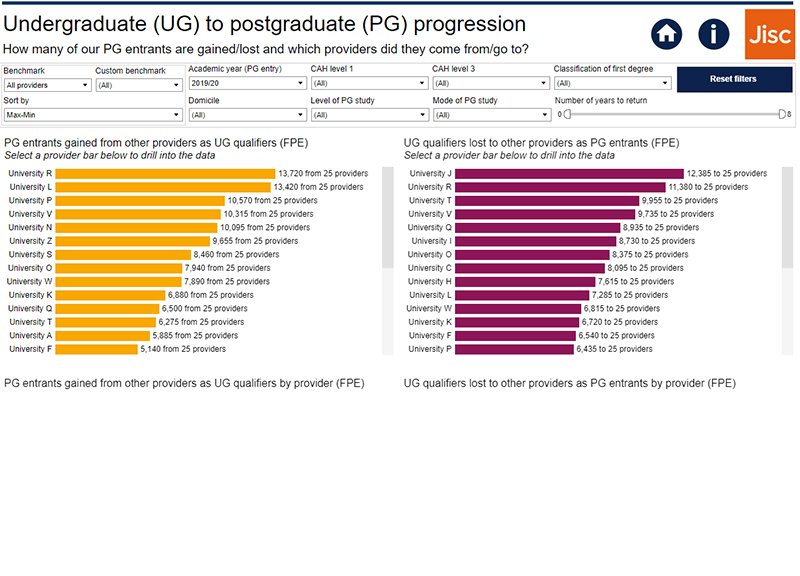
Showing example data for “University C” this dashboard distinctly shows on the left the number of postgraduate students gained from other undergraduate providers, and on the right where University C has lost students who have graduated at undergraduate level and gone onto study at postgraduate level elsewhere.
The data can be filtered to display results at the click of a button making comparisons quick and simple to understand.
Please note: this example uses synthetic and anonymised data.

Example dashboard: Complementary subjects
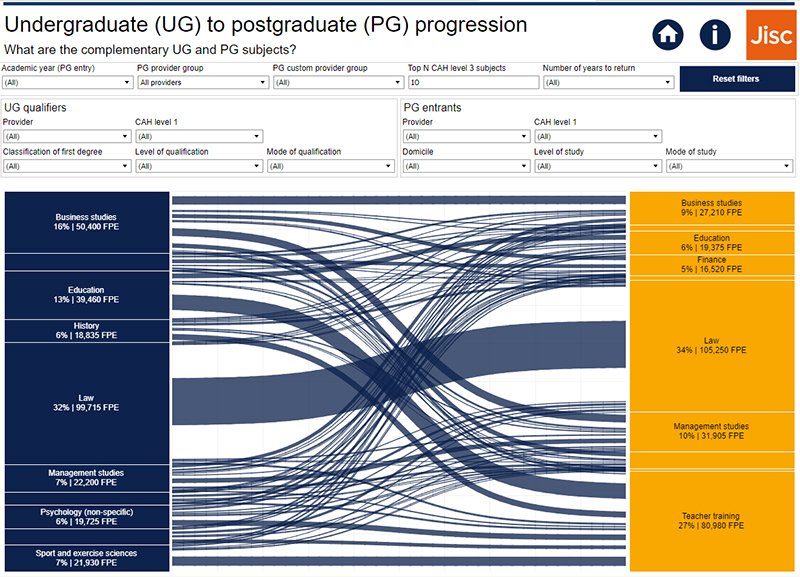
This graphic allows the dashboard user to visualise the complementary undergraduate and postgraduate subjects.
Please note: this example uses synthetic and anonymised data.

This graphic allows the dashboard user to visualise the complementary undergraduate and postgraduate subjects.
Please note: this example uses synthetic and anonymised data.

Who is it for?
The discover progression – undergraduate to postgraduate interactive dashboard suite is ideal for the following higher education professionals:
- Strategic planners
- Postgraduate recruiters
- Postgraduate portfolio planners
Accessing the dashboard
Once subscribed, the dashboard suite will be delivered via your Heidi Plus account.
To access Heidi Plus, please contact your organisation’s Heidi Plus lead contact or email customer.success@jisc.ac.uk.
Pricing
Discover progression – undergraduate to postgraduate is available with an annual subscription fee between £768 - £3,488 + VAT (dependent on the number of students at your provider).
Data source
The data within discover progression is quality assured and goes through strict validation processes. This product is based on multiple years of linked HESA student data.
Support
Our experienced customer success team are on hand to answer your general user queries. To get in touch, email customer.success@jisc.ac.uk.
Get started
Register for more information and arrange your initial consultation
About the co-design group
The following providers were represented in the co-design group:
- The University of Sheffield
- City University
- Middlesex University
- Bangor University
- Falmouth University
- Queen Mary University of London